tinyx.co

01
Per-platform breakdown
Instagram, TikTok, YouTube, X, email — TinyX logs the referrer on every tap. See exactly which platform drives the most clicks, and more importantly, which converts best. No more "I think TikTok is working" guesses.
tinyx.co

02
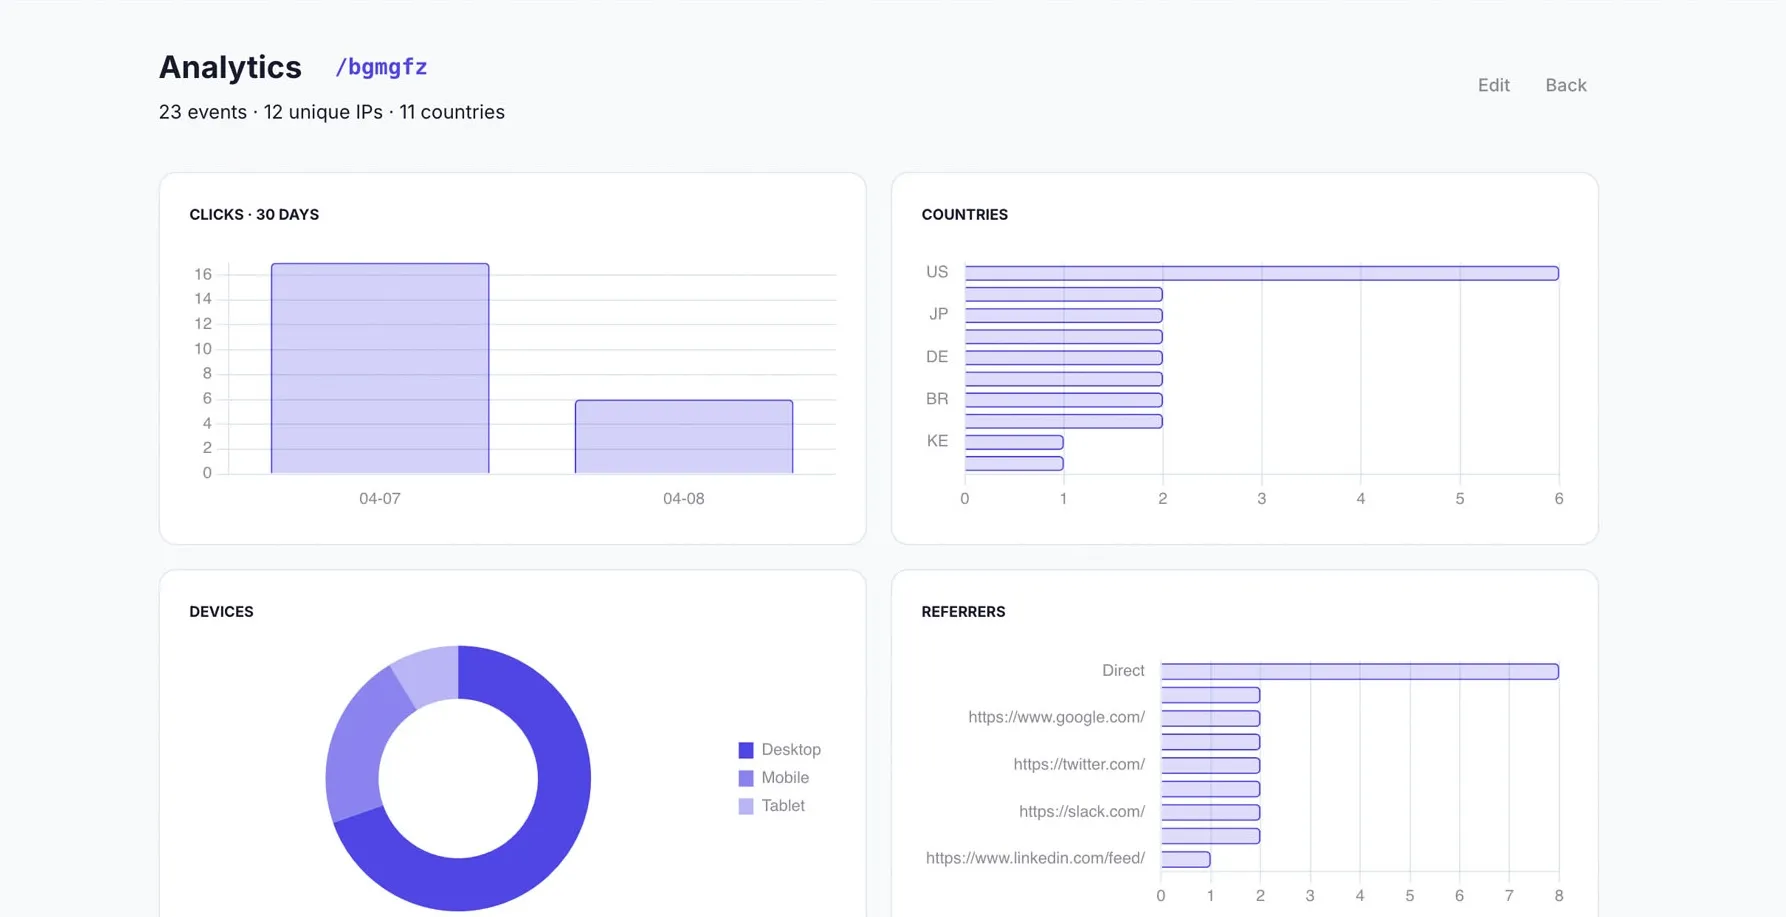
Audience geography
Country, city, region, timezone — on every click. Planning a tour? Dropping merch? Know which cities will actually show up before you book the venue or press a single shirt.
tinyx.co
03
Device & referrer data
iPhone or Android? Chrome or Safari? iOS 17 or 18? Every tap tagged with device, browser, OS, and referrer. Design for where your audience actually is, not where you assume they are.